GNSS interference used to be a footnote — an occasional anomaly logged near a missile range or a contested border. It is now a structural feature of the global navigation environment. Aircraft lose position fixes over the Baltic on a routine basis. Hundreds of ships are simultaneously teleported onto a map. Timing networks drift. And almost none of it is confined to declared conflict zones anymore.
This article does something the day-to-day headlines rarely do: it steps back and looks at the data. Where is interference actually concentrated? How fast is it growing? What do the trend lines say about the next few years? And — the question that matters most to anyone specifying a GNSS antenna — what does this landscape mean for how receiving systems should be designed?
We have written before about the countermeasures — our ultimate guide to anti-jamming GNSS antennas, how to measure anti-jamming performance, and how to choose a CRPA element count. This piece is about why those questions have become unavoidable.
How we know: the data behind the maps
Before trusting any “interference hotspot map,” it is worth understanding where the underlying data comes from — and where it falls short. There is no single global sensor network for GNSS interference. Instead, the public picture is assembled from several independent sources, each with a different bias.
Crowdsourced aircraft telemetry. The best-known public tool, GPSJam.org, builds daily maps from ADS-B data supplied by aircraft. It flags grid cells where a significant share of aircraft report low navigation accuracy. The strength of this method is global coverage; the weakness is interpretive. The data records degraded accuracy, not cause — and the site’s own maintainers are explicit that a flagged region is a region of suspected interference, not confirmed jamming.
Spoofing-specific detectors. Because a spoofed receiver often still reports good accuracy — it has been fooled, not blinded — pure accuracy-based maps under-represent spoofing. Newer trackers, such as the SkAI Data Services and Zurich University of Applied Sciences project built on OpenSky Network data, look instead for position anomalies: aircraft whose reported location jumps in physically impossible ways. The Stanford GPS Laboratory has published comparable analyses of ADS-B-derived spoofing for 2024–2025.
Satellite-based observation. Operators including Spire have used space-based ADS-B receivers to capture GNSS integrity metrics across hundreds of aircraft at once, and research using NASA’s CYGNSS constellation has demonstrated detection of jammer emissions from orbit by analyzing reflected-signal noise floors.
Maritime and regulatory reporting. For ships, the picture comes from AIS anomaly analysis and from incident reports collected by national authorities, classification bodies, and UN agencies.
Two caveats are worth carrying through the rest of this article. First, not every flagged region is hostile interference — for example, persistent low-accuracy readings over parts of the southwestern United States are attributed to military trainer aircraft whose own maneuvers temporarily shadow their GPS antennas, not to jamming. Second, the data almost certainly understates spoofing, for the reasons above. The numbers below should therefore be read as a conservative floor, not a ceiling.
The aviation picture: a step-change, not a blip
Aviation produces the cleanest longitudinal dataset, because incidents are systematically logged. The trend is unambiguous.
According to IATA’s analysis of its Global Aviation Data Management Flight Data eXchange, GPS signal-loss events rose by roughly 220% between 2021 and 2024. Spoofing — the more sophisticated and more dangerous category — grew even faster, with industry reporting an increase on the order of several hundred percent in a single year as the technique spread from a curiosity to a commonplace.
The single most cited figure comes from a joint report that Sweden and five neighboring states submitted to ICAO: nearly 123,000 flights were disrupted between January and April of 2025 by jamming and spoofing in northern Europe alone. Those disruptions affected 365 airlines operating over Poland, the Baltic states, Finland, and Sweden, and were traced to emitter regions around Kaliningrad, St. Petersburg, Smolensk, and Rostov. In April of that year, more than 27% of flights in the affected region encountered interference, with some local areas exceeding 40%.
That regional figure is consistent with the broader European picture: analysts now estimate that roughly 40% of European air traffic operates in airspace meaningfully affected by GNSS interference, and authorities in frontline states have described five- to ten-fold increases in disruption over a single year. Lithuanian representatives told an ICAO assembly in late 2025 that they were seeing hundreds of interference events per week — roughly twenty times the rate of the year before.
The human cost stopped being theoretical on 25 December 2024, when Azerbaijan Airlines Flight 8243 crash-landed in Kazakhstan after experiencing GPS jamming; 38 of the 67 people on board were killed. The official investigation was still open at the time of writing, but if its findings hold, this would be the first loss of civilian life linked to GNSS radio-frequency interference.
The regulatory response tracks the data. EASA’s Safety Information Bulletin on GNSS outages has gone through multiple revisions; the FAA issued a Safety Alert for Operators; and in June 2025 EASA and IATA published a joint mitigation plan whose central message was a deliberate shift in posture — from “containment” to “resilience.” That phrasing matters. It is an institutional admission that interference is no longer an exception to be cleared up, but a permanent condition to be engineered around.
The maritime picture: fewer reports, larger events
Ships generate fewer logged incidents than aircraft, but maritime events tend to be dramatic in scale because a single spoofer can capture every vessel in a busy waterway at once.
The clearest example came in April 2024, when 117 ships were simultaneously displaced on AIS to Beirut’s airport by falsified GNSS signals; a related event later affected 227 vessels across the Eastern Mediterranean. The scale escalated again in mid-2025, when maritime-intelligence analysts reported more than 3,000 vessels disrupted in and around the Persian Gulf. On the other side of the continent, Latvian authorities had logged over 820 jamming incidents by mid-2025.
A newer and more troubling development is mobile maritime interference. Satellite analysis of the Baltic has produced some of the first publicly verified evidence of ship-borne jammers — interference sources that move with vessel traffic rather than radiating from a fixed coastal site. A mobile emitter is far harder to map, predict, or avoid than a stationary one, and it undermines the usefulness of any static hotspot map.
The institutional response again mirrors aviation. ICAO, the ITU, and the IMO issued a joint statement in March 2025; thirteen coastal European nations plus Iceland collectively flagged “growing GNSS interference” in January 2026; and the EU has moved to deploy anti-spoofing signal authentication for Galileo alongside a dedicated interference-monitoring service.
The geography: where the hotspots actually are
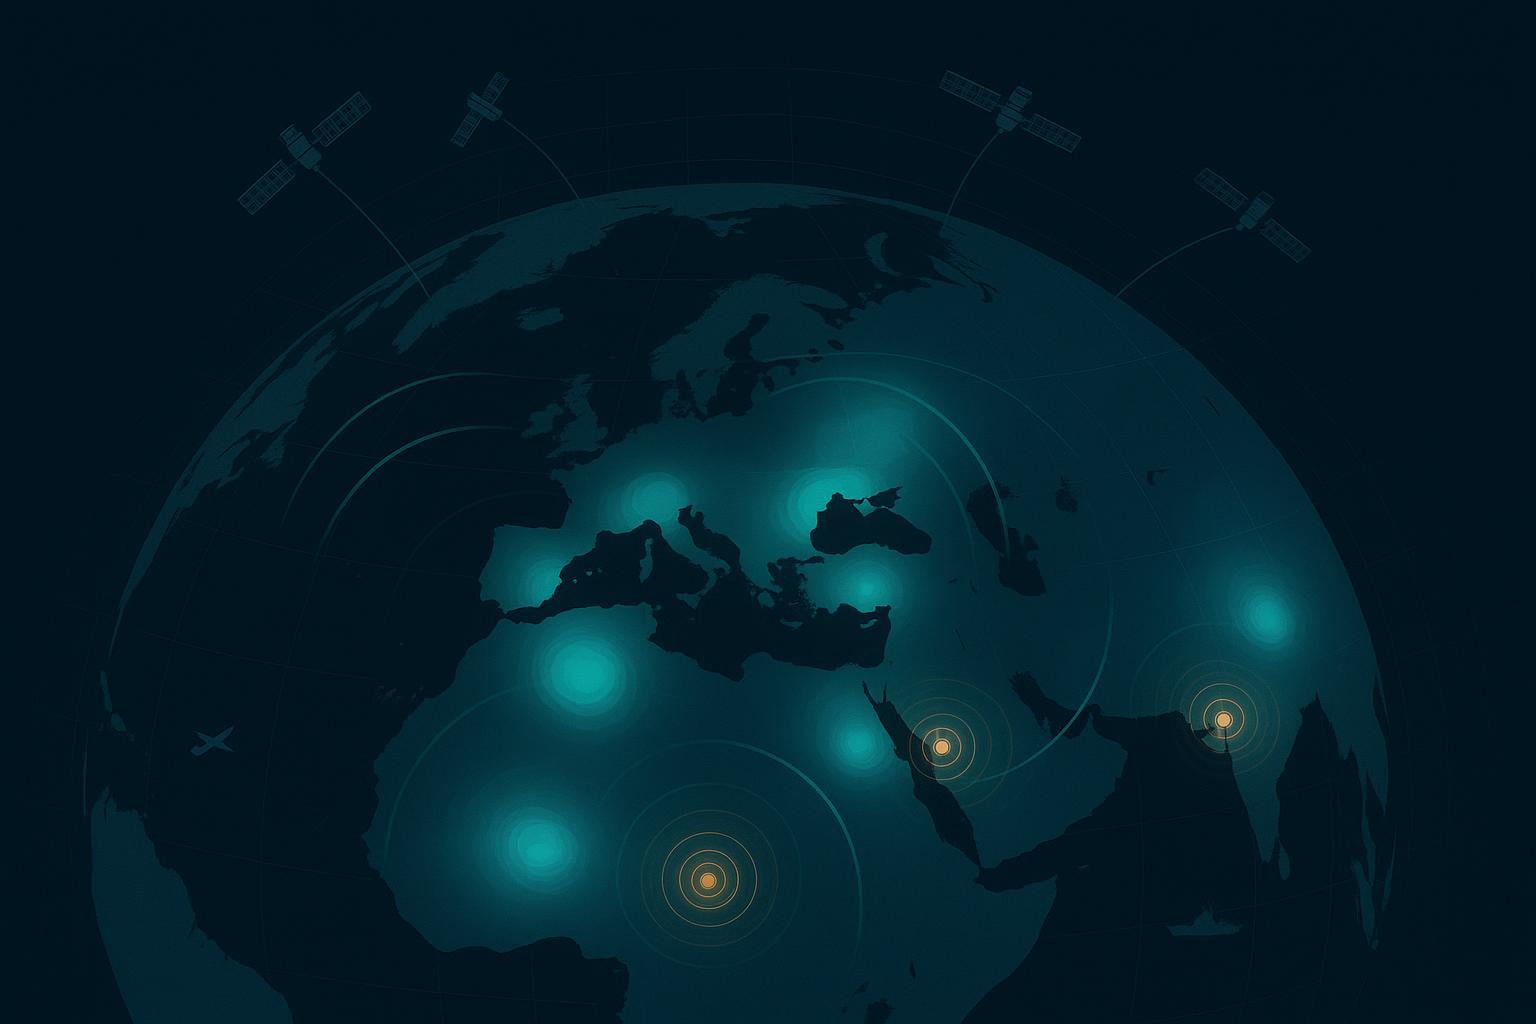
Pulling the sources together, public interference data over 2021–2026 concentrates in a recognizable set of corridors.
Region | Primary character | Notes |
|---|---|---|
Black Sea / Crimea | Near-continuous jamming and spoofing | Romanian and Bulgarian airspace and surrounding waters consistently affected |
Baltic Sea & Gulf of Finland | Heavy jamming, growing spoofing | Origins associated with Kaliningrad and the Kola Peninsula; ship-borne emitters now confirmed |
Eastern Mediterranean | Large-scale spoofing | Israeli, Lebanese, and Cypriot airspace; site of the 117-ship Beirut event |
Eastern Turkey → Iraq / Iran / Armenia | Long-standing jamming corridor | Identified by Eurocontrol as a persistent zone |
Southern Cyprus → Egypt | Spoofing corridor | One of the three dominant false-position "destinations" |
Persian Gulf / Red Sea / Gulf of Aden | Episodic, conflict-linked | Thousands of vessels affected in 2025 |
One pattern is worth isolating. Spoofing, unlike jamming, has destinations — the false coordinates a victim receiver is pushed toward. Across 2024–2025, three locations dominated as spoof targets: Sevastopol, Beirut, and Cairo. An aircraft over the Black Sea, the Eastern Mediterranean, or Egypt would frequently “believe” it was sitting at one of those three points. That signature is useful: a receiver or flight crew that knows the regional spoof destination can recognize the attack faster.
What the trend lines actually say
Three structural shifts emerge from the five-year record, and each has direct engineering consequences.
1. Escalation is sustained, not cyclical. This is not a spike that will subside. Across every independent dataset — aviation logs, maritime reports, satellite observation — the direction is the same and the slope is steep. Year-on-year multiples of 5×, 10×, and 20× appear repeatedly in different regions. Designing to last year’s threat level is designing to be obsolete.
2. The threat is migrating outward. The early hotspots sat directly on conflict lines. The current ones do not. Interference is now routinely detected well over 1,000 km from any active conflict, and affected airspace includes ordinary commercial routes across northern and southeastern Europe. The phrase that recurs in industry statements — interference “beyond conflict zones” — is the single most important takeaway for anyone who assumed their application was geographically safe.
3. Jamming is giving way to spoofing. Jamming denies a signal; the receiver at least knows it has lost service. Spoofing replaces the signal, and a naïve receiver will confidently act on a lie. The growth rate of spoofing has outpaced jamming, and spoofing is precisely the failure mode that simple signal-strength monitoring cannot catch.
Why this matters beyond aircraft and ships
It is easy to read the data above as an aviation-and-maritime problem. It is not. Every figure in this article is a proxy for the health of the same L-band spectrum that every other GNSS application depends on.
A jammer that disrupts an airliner’s approach also disrupts the surveying crew, the agricultural machine, the autonomous vehicle, and the telecom timing reference operating in the same airspace footprint. The consequences simply look different by application: a CORS station logs corrupted observations instead of issuing a diversion; a 5G base station’s timing holdover counter starts running; an RTK rover drops from a fixed to a float solution. The interference is identical. Only the symptom changes.
In other words, the maps in this article are not a niche concern for operators near the Black Sea. They are an early-warning indicator for the entire GNSS-dependent economy.
Engineering implications: designing for a contested spectrum
If interference is now a permanent operating condition, it has to be treated as a design input — the same way a structural engineer treats wind load. A few principles follow directly from the data.
Multi-constellation and multi-frequency are baseline resilience, not premium features. Many jammers are narrowband and target a single band — most often GPS L1. A receiver tracking BDS, GPS, Galileo, GLONASS, QZSS, and SBAS across multiple frequencies has somewhere to fall back to when one band is denied. Constellation and frequency diversity is the cheapest resilience available, and it starts at the antenna: the antenna must actually pass the full set of bands the receiver hopes to use.
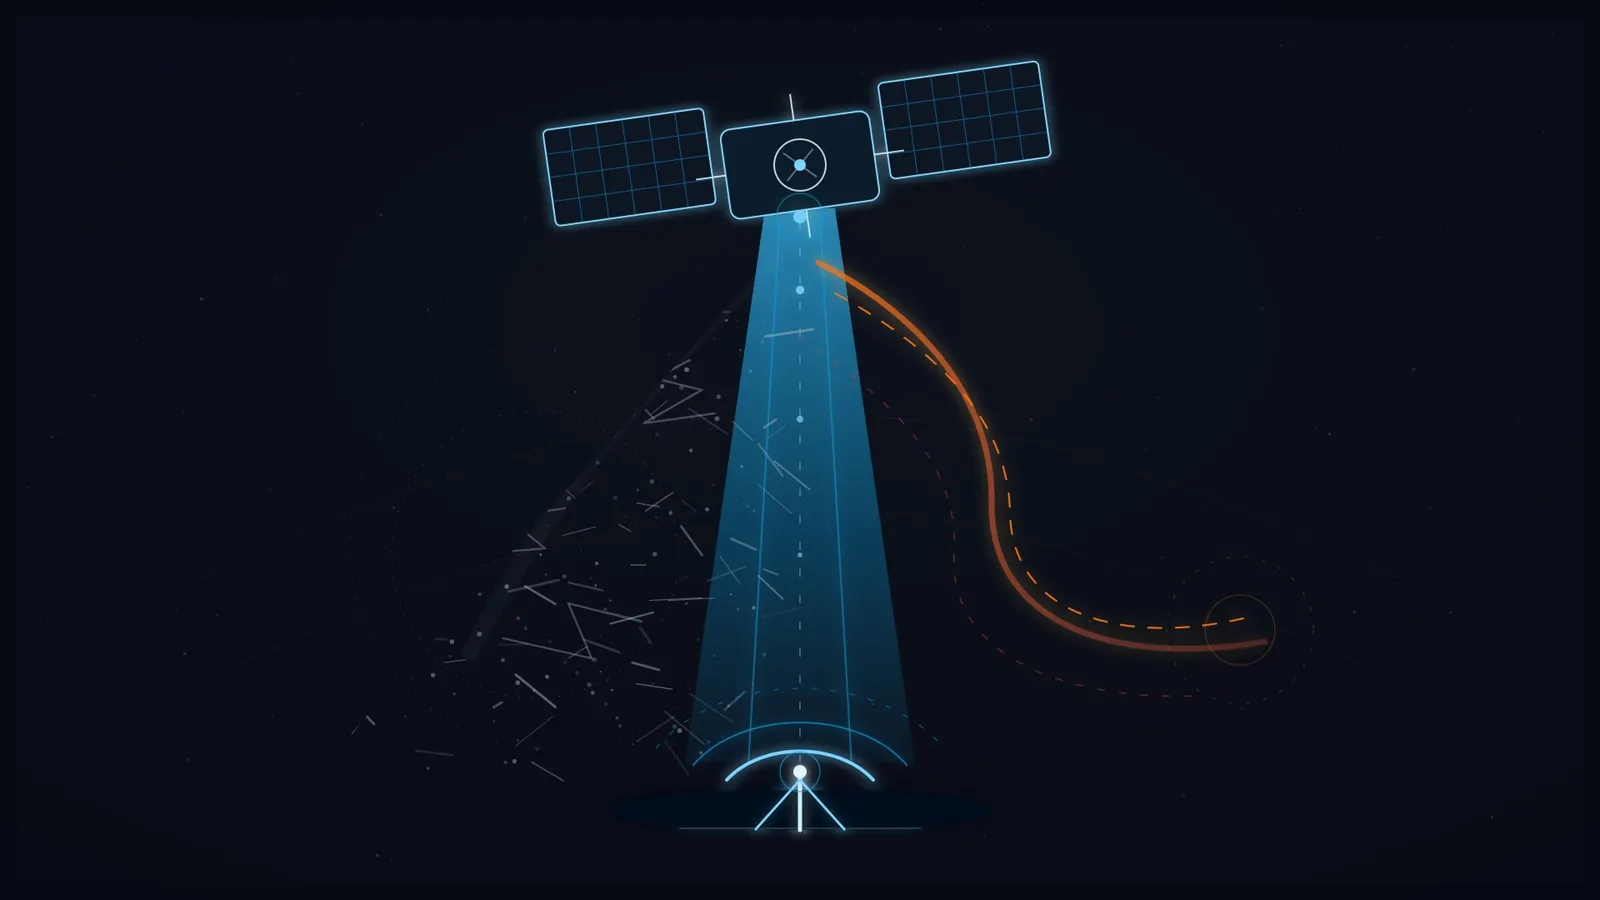
Spatial filtering is the answer to spoofing that signal monitoring cannot provide. Because spoofing defeats signal-quality checks, the most robust countermeasure is to discriminate by direction of arrival — rejecting energy that does not come from the satellite geometry overhead. This is exactly what a controlled reception pattern antenna (CRPA) does: a multi-element array with adaptive beamforming steers nulls toward jammers and spoofers while keeping gain toward legitimate satellites. The right element count is an application trade-off — more elements mean more simultaneous threats suppressed, at a cost in size, weight, and price — but the principle is constant: against a directional threat, a directional antenna is the structural fix.
Robustness specifications must be explicit. “Anti-jam” is not a number. Useful procurement specifications name the metrics that actually predict field behavior — null depth, jammer-to-signal handling, out-of-band rejection, and phase-center stability under beamforming — and the platform must be tested against them rather than against a datasheet adjective.
Plan for layered PNT. No antenna makes interference disappear. The resilient architectures emerging from the aviation and maritime sectors are layered: a hardened antenna front end, a receiver with spoofing-detection logic, an inertial system for ride-through, and a clear-eyed assumption that the GNSS input may be hostile. The antenna is the first layer — and the only one that can reject a threat before it ever reaches the receiver — but it is one layer of several.
Outlook
Nothing in five years of data suggests the interference environment will quieten. The emitters are cheap, the techniques are spreading, and the geography is widening. The institutional response has shifted, correctly, from cleaning up incidents to building resilience — and that shift has to reach hardware specifications, not just operational procedures.
For system designers, the practical conclusion is simple. The question is no longer whether a GNSS-dependent platform will encounter interference, but where and how often — and the maps in this article already answer both. Designing the antenna and receiver chain around that reality is no longer a defense-only concern. It is ordinary engineering prudence.
GNSource designs and manufactures multi-constellation GNSS antennas and 4-to-32-element anti-jamming CRPA arrays for defense, aviation, surveying, UAV, and timing applications. If you are specifying a receiving system for a contested-spectrum environment, our engineering team can help you match antenna architecture to your threat model — request a quote.
Sources and further reading
-
IATA / EASA — Comprehensive Plan to Mitigate GNSS Interference (June 2025); GADM Flight Data eXchange analysis
-
EASA — Safety Information Bulletin 2022-02 (and revisions); FAA — Safety Alert for Operators 24002
-
ICAO submission by Sweden and neighboring states on Q1 2025 flight disruptions
-
Stanford GPS Laboratory — ADS-B observations of aviation spoofing, 2024–2025
-
GPSJam.org and its FAQ; SkAI Data Services / Zurich University of Applied Sciences spoofing tracker
-
Spire — satellite-based GNSS interference analysis, Baltic Sea
-
Maritime GNSS interference cumulative analyses (2021–2025) and IMO/ITU/ICAO joint statement, March 2025