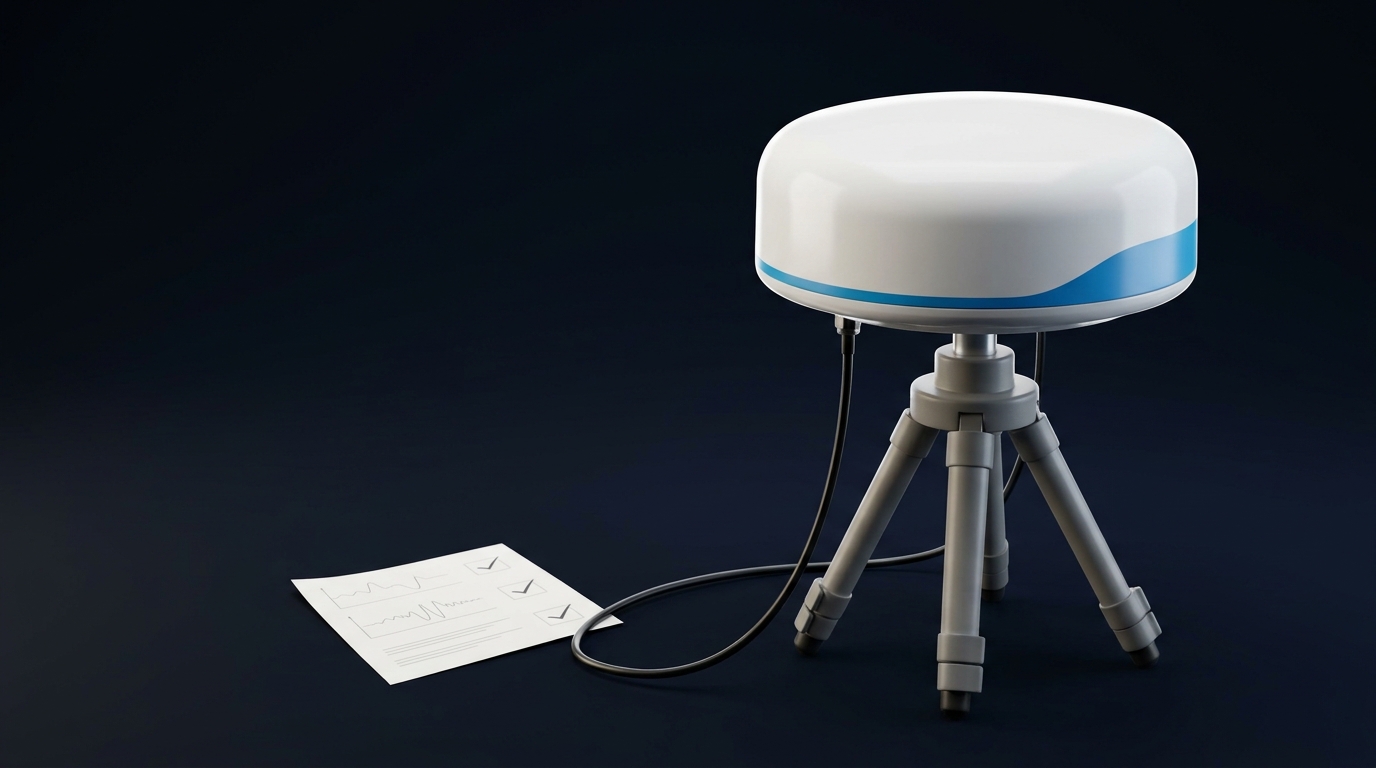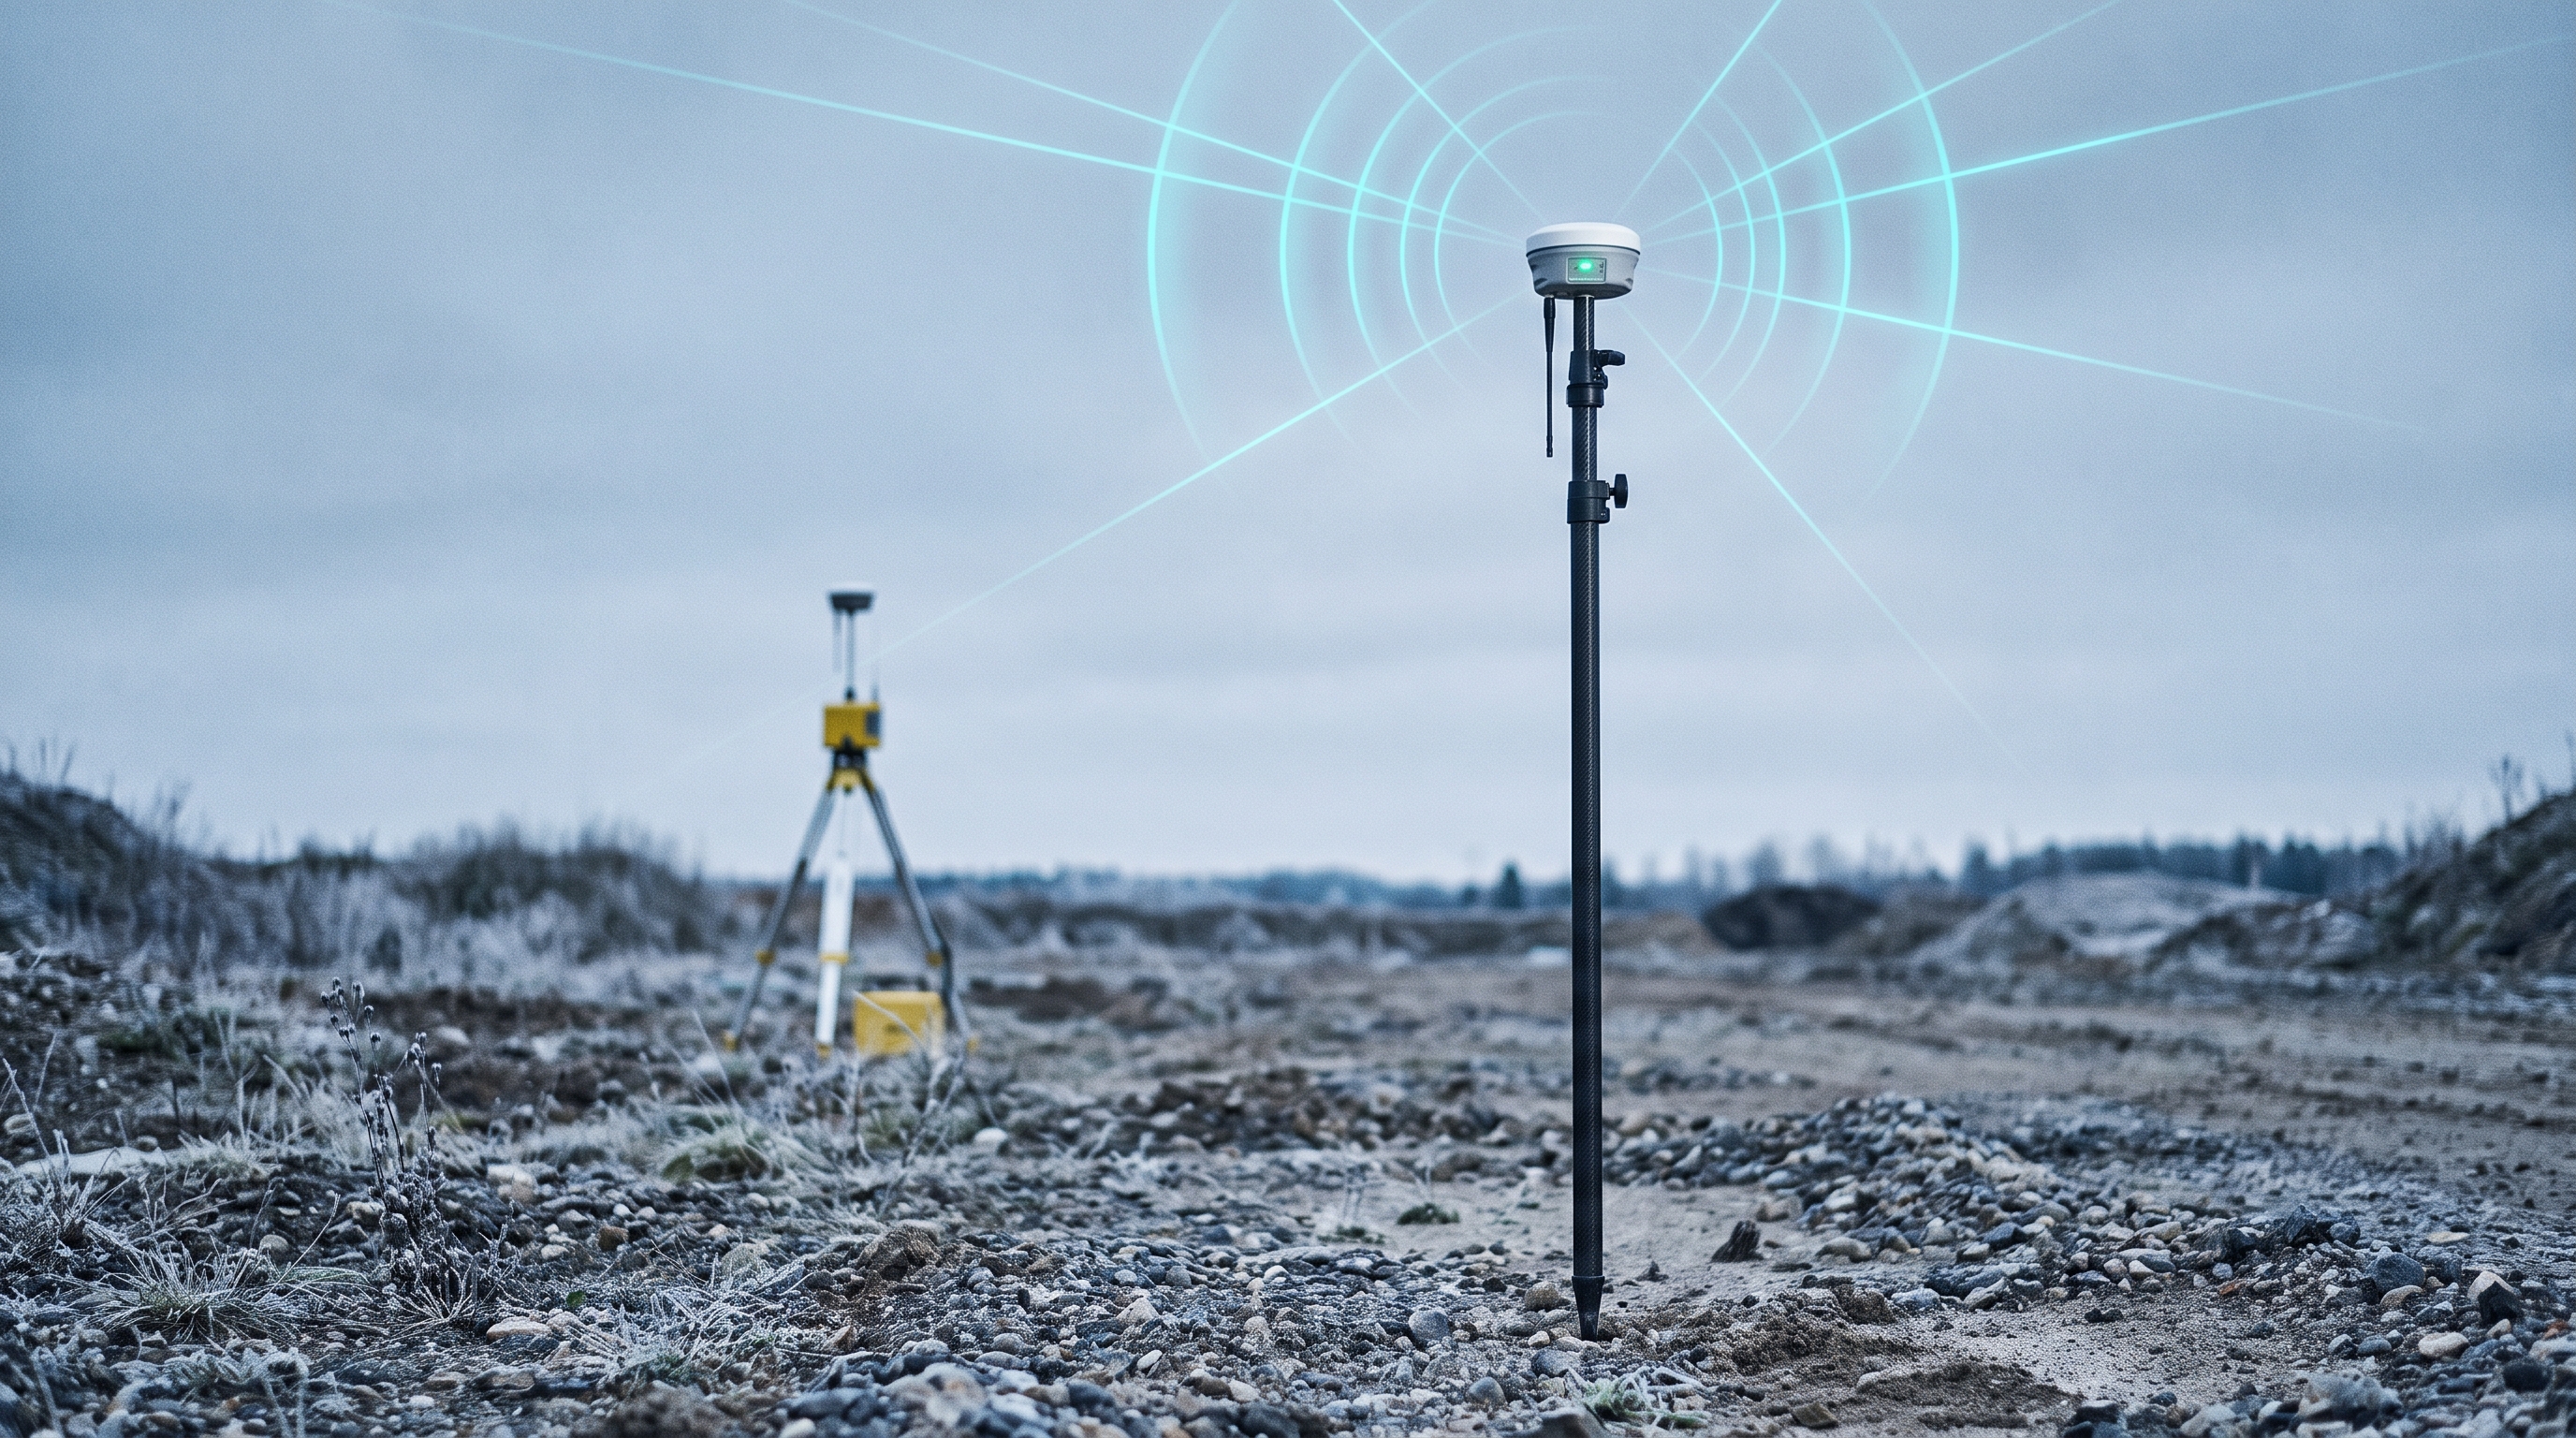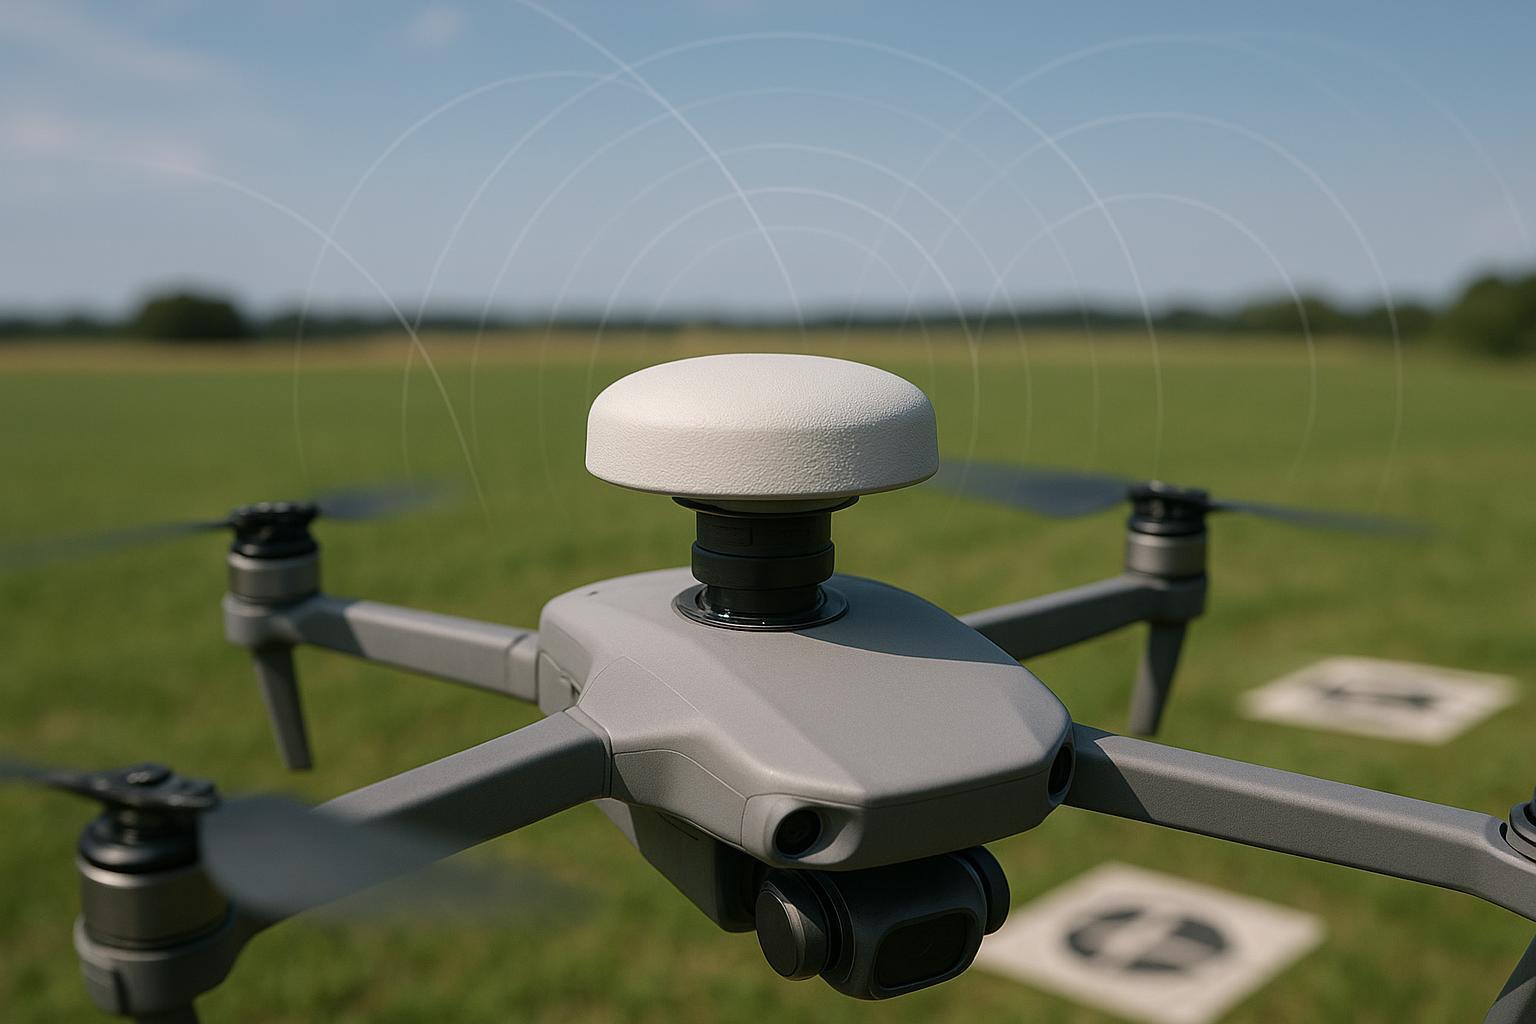
When a drone leaves the lab and enters dust, rain, salt spray, and baggage handlers’ hands, a radome feels non‑negotiable. But the same thin shell that keeps water and fingers off the feed can quietly trim C/N0, shift the phase center, and nudge your RTK solution from “rock solid” to “why did we just lose fix on final approach?” I’ve been on both sides of that moment—bench tests that looked great, and then a flight log full of longer TTFF, lower fix ratio, and centimeter‑class biases that weren’t there yesterday.
This article explains the GNSS antenna radome tradeoffs and how to design and validate them so you keep the protection without paying an avoidable accuracy tax—one piece of the wider high-precision GNSS antenna selection puzzle. I’ll share field‑observed thresholds, a reproducible A/B workflow, and a realistic UAV scenario you can adapt next sprint.
Why GNSS Antenna Radome Tradeoffs Matter for RTK on Drones
RTK loves stable phase and clean signal. A radome that adds elevation‑dependent phase delay or trims C/N0 pushes in the opposite direction. In geodetic practice, antennas are calibrated as antenna+radome systems; omit the correct entry and you bias heights by millimeters at low elevations. That isn’t hearsay—absolute robot calibrations and network analyses show it.
-
With a standard geodetic cover installed, vertical PCV often changes by about 2–4 mm at 5–10° elevation and less than 1 mm above ~20°, with vertical PCO shifts around 1–2 mm. That’s documented in Wanninger & Beer (2015) and echoed by Schmid et al. (2016), which also explains why IGS antenna files list distinct entries per antenna+radome.
-
Translate that to a UAV: banked turns and low‑elevation tracking are where your C/N0 is already under pressure (prop wash, airframe shadowing). A further 0.5–2 dB drop plus a few mm of elevation‑dependent phase error is enough to extend TTFF, erode fixed‑solution percentage in marginal segments, or leave residual biases in long baselines.
If you’re thinking “a thin cover can’t matter that much,” think of it this way: carrier‑phase RTK is counting centimeters from waves 19–24 cm long; millimeter‑level phase mis‑modeling is not small.
What a Radome Does to the RF Path
A radome changes the electromagnetic environment in front of the antenna. At L‑band, three mechanisms dominate:
-
Insertion loss and phase delay: Dielectric constant (εr), loss tangent (tanδ), and wall thickness set how much amplitude and phase the signal picks up as it passes the wall. Even a couple of dB of loss at marginal elevation angles can slow ambiguity resolution, and a few millimeters of added phase delay—especially when it varies with elevation—maps directly to PCO/PCV differences. EM studies show clear patterns: geometry and thickness drive the penalty, while better material selection reduces it. See the simulation‑plus‑build analysis in the 2019 radome degradation study for how AR and gain move with material and spacing.
-
RHCP purity and axial ratio: A non‑ideal cover can degrade axial ratio, letting more LHCP and cross‑polarized multipath leak into the receiver.
-
Internal reflections and edge diffraction: Parallel surfaces act like a weak etalon. Reflections between the antenna and inner wall can create elevation‑dependent group delay ripples; sharp lips and steps around the aperture diffract energy and seed near‑field multipath.
If you’ve ever compared patterns with and without a cover in an anechoic chamber, you’ve seen the tell: slightly lower peak gain, a rougher axial‑ratio curve, and sometimes subtle pattern scalloping near the horizon.
Mounting and Installation Details That Matter More Than You Think
In practice, mounting choices can cost more than the dielectric itself:
-
Standoff and proximity: Keep roughly ≥10 cm of dielectric standoff from carbon fiber or large metal near the aperture. Recessed “cup” mounts trap reflections; raised, flush, and smooth surroundings behave better. Educational notes on site‑dependent errors emphasize how near‑field clutter degrades SNR and seeds multipath; the UAV translation is simple: clean the neighborhood. See UNAVCO’s overview of antenna sensitivity to site‑dependent error sources.
-
Bonding and common‑mode control: Provide a single, intentional bond from antenna ground to the airframe’s reference; avoid loops. Ferrite chokes at the antenna end of the coax reduce common‑mode pickup from ESCs and switching supplies.
-
Cable routing and strain: Don’t run coax parallel and close to power harnesses; minimize bends near the feed; anchor for vibration so the electrical path is stable across flight.
I’ve fixed more “radome problems” by moving the antenna 10 cm away from a carbon‑fiber plate and adding a ferrite than by swapping materials.
Field‑Ready A/B Workflow to Quantify Radome Impact
You don’t need a national lab to do this right. Here’s a repeatable approach I’ve used with drone teams:
-
Baseline flights (no radome): Mount the antenna on a 10 cm dielectric standoff in a clean location. Fly 15–20 sorties over a surveyed test field (5–50 m AGL, open sky). Log RINEX, receiver C/N0, fix/float states, and TTFF. Record environmental notes (temp, wind, humidity).
-
Candidate radome flights: Install the radome with identical mounting. Repeat the sorties within similar conditions. If coatings are involved, test coated vs uncoated separately.
-
Process with identical settings: Same elevation mask (e.g., 10°), ambiguity strategy, and smoothing. Produce per‑band mean C/N0 deltas, elevation‑binned phase residuals, fixed‑solution percentage, TTFF deltas, and horizontal RMS vs control points.
-
Decide with thresholds: Accept if mean SNR loss ≤ 2 dB across visible satellites and bands; mean elevation‑binned PCV delta ≤ 5 mm across operational angles; fixed‑solution rate drop ≤ 5% absolute; TTFF increase ≤ 25%.
The rationale lines up with lab and geodetic literature: radomes typically produce ~0.5–2 dB SNR reduction and a few millimeters of PCV shift at low elevations; when you quantify and compensate, RTK stays robust. For background on AR/gain penalties and why material/thickness matter, see the 2019 radome study; for calibration concepts and separate antenna+radome entries, review Schmid et al. (2016).
Example summary from a representative quadcopter campaign (field‑observed):
Metric | Baseline (no radome) | With 2 mm fiberglass radome | Delta |
|---|---|---|---|
Mean C/N0 L1 (dB‑Hz) | 43.1 | 41.7 | −1.4 |
Mean C/N0 L2 (dB‑Hz) | 38.6 | 37.2 | −1.4 |
Elevation‑binned phase bias (mm, 10–30°) | 0–2 | 3–6 | +3–4 |
Fixed‑solution percentage | 94% | 89% | −5% |
TTFF median (s) | 14 | 17 | +3 |
Horizontal RMS (cm) | 2.8 | 3.4 | +0.6 |
Numbers vary by airframe, coating, and weather, but the pattern is consistent.
Realistic UAV Scenario and Results
We ran a production‑style A/B on a mapping quadcopter with a 1.2 km network RTK baseline. The antenna (RHCP patch) sat on a 10 cm fiberglass standoff; flights were 5–50 m AGL over an open field with surveyed GCPs. Twenty sorties without a radome established the baseline; we then added a 2 mm fiberglass cover (εr ≈ 4–4.5) and repeated the flights. We held the elevation mask at 10° and used the same ambiguity strategy and logging.
Field‑observed outcomes matched expectations: C/N0 dipped by ~1–2 dB depending on band and attitude; elevation‑dependent phase residuals grew by a few millimeters in the 10–30° bin; fixed‑solution percentage fell modestly under low‑elevation passes, and TTFF increased slightly. After applying a per‑stack PCO/PCV correction derived from the A/B, the fixed‑solution percentage recovered within ~1% of baseline and horizontal RMS returned to within a few millimeters.
Micro‑example (brand mentioned neutrally): In one integration using a GNSS patch from GNSource, adding a thin (2 mm) fiberglass radome reduced mean L1/L2 C/N0 by about 1.3–1.6 dB and introduced a 3–5 mm elevation‑dependent phase shift if left uncalibrated. Post‑calibration (stack‑specific PCO/PCV applied) restored the fixed‑solution rate to the pre‑radome level on comparable sorties. The material and thickness were typical for small‑UAV shells; the key was measuring and compensating rather than assuming “thin means negligible.”
PCO PCV Radome Corrections in Production
Treat the antenna+radome as one calibrated system:
-
Calibrate PCO/PCV on the exact stack: Robotized absolute calibrations are gold standard; lightweight alternatives include a rotating rig and field differential methods. Geodetic authorities document why this matters and publish separate antenna+radome entries—see Schmid et al. (2016) for methodology and file conventions.
-
Apply per‑stack corrections in processing: If your receiver or post‑processor accepts ANTEX‑style tables, use them. Otherwise, implement elevation‑binned offsets or a small PCO tweak derived from your A/B.
-
Record and track: For production lines, keep a per‑unit calibration or acceptance record with serials, material batch, thickness measurements, and the applied correction version. It saves weeks during fleet investigations.
Materials and Design Choices That Reduce Penalties
Materials are your biggest lever after placement:
-
Favor low‑εr, low‑loss laminates: PTFE‑based composites and low‑loss ceramics generally beat generic FRP at L‑band for both loss and phase stability. Rogers’ families offer examples and property references—e.g., RO3003G2 (stable, low loss) and RO4003C (slightly higher Dk/loss). See the RO3003G2 datasheet and RO4003C datasheet for typical properties; always verify at L1/L2/L5.
-
Minimize thickness consistent with strength: Small‑UAV walls often land around 1–3 mm. Thinner usually means less phase delay, but check buckling, impact, and mounting loads. Many fiberglass radomes are built near 2.0 mm as a strength/weight compromise; see a representative 2.0 mm FRP case.
-
Control geometry and transitions: Avoid sharp steps and deep lips around the aperture; chamfer edges to reduce diffraction. Keep the inner air gap consistent to avoid etalon resonances.
-
Coatings: Hydrophobic and anti‑icing polymer films that are thin and uniform (<100 µm) tend to have minimal L‑band penalty; conductive anti‑static coatings can add measurable loss depending on sheet resistance—validate before committing.
-
Environmental and qualification context: If your program follows avionics practices, DO‑160 environmental categories (temperature/altitude, vibration, water/icing, RF susceptibility) will shape material and mounting choices. A practical, public overview of categories is available in this DO‑160 summary; use the official standard for test plans.
Practical Checklist for Teams Shipping Drones
-
Select low‑loss, low‑εr materials; target the thinnest wall that passes mechanical tests; chamfer edges and keep a uniform air gap.
-
Place the antenna with roughly ≥10 cm dielectric standoff from carbon fiber or metal; avoid recessed cups; route coax clear of power wiring; add a ferrite at the antenna end.
-
Run paired flights (no cover vs cover) on a surveyed field; log RINEX, C/N0, fix/float, TTFF, and compute horizontal RMS; accept only if SNR loss ≤ 2 dB, mean PCV delta ≤ 5 mm, fixed‑solution drop ≤ 5%.
Short FAQ
Q: Are thin radomes (1–2 mm) effectively transparent at L‑band? A: Not entirely. Field results and lab work show ~0.5–2 dB C/N0 loss and a few millimeters of elevation‑dependent phase change are common. Small in absolute terms, but large enough for RTK if you don’t calibrate.
Q: Do coatings matter for GNSS? A: Thin hydrophobic/anti‑icing polymers usually don’t hurt much if uniform. Conductive anti‑static layers can add 1–3 dB loss depending on sheet resistance—measure S‑parameters on coupons and confirm with C/N0 maps.
Q: How much SNR loss is acceptable before I should reject a radome design? A: As a general field threshold: keep mean loss across visible satellites and bands within 2 dB; beyond that you’ll feel it in fix ratio and TTFF on marginal segments.
Q: Can I skip lab calibration and rely only on flight A/B? A: For small teams, yes—if you do enough paired sorties and compute elevation‑binned residuals to build a usable correction. For production lines or certification paths, pursue absolute PCO/PCV calibration and manage the stack as a controlled configuration.
Q: Any references to back up the mm‑level phase and dB‑level SNR changes? A: Yes. The 2019 radome analysis demonstrates AR/gain penalties vs material and thickness. Geodetic calibration papers—Wanninger & Beer (2015) and Schmid et al. (2016)—document mm‑level PCO/PCV changes and the practice of distinct antenna+radome calibrations. For site‑dependent impacts and multipath context, see UNAVCO’s guidance.
Next Steps
For radome‑tested antenna options or integration questions, contact GNSource.